我最近一直在尝试FastAPI,这是一个自称为“高性能、易于学习、快速编码、可用于生产”的 Python API 框架。
我希望我的项目具有的功能之一是从应用服务器到 SQL 请求完全异步。由于 API 主要受 I/O 限制,这将允许它使用单个服务器进程处理许多并发请求,而不是像 Flask/Gunicorn 中常见的那样为每个请求启动一个线程。
然而,这在分析代码和解释结果时提出了挑战。
cProfile分析异步代码时的限制
例如,以下图形表示是根据cProfile记录对单个 API 端点的 300 次连续调用以及关联的get_character 处理程序的配置文件生成的。

放大后,我们注意到关于get_character跨度的两件事:
ncalls当我们真正调用它300次时,它的值是9605- 它是自由浮动的,与任何其他跨度完全无关
由于异步函数是由事件循环在每个await子句中“进入”和“退出”的,因此每次事件循环重新进入函数时,cProfile都会将其视为额外的调用,从而导致看似大于正常的ncalls数字。事实上,我们await每次执行 SQL 请求、提交或刷新 SQLAlchemy 会话或任何其他引发异步 I/O 的操作。其次,跨度之所以get_character看起来是自由浮动的,是因为它是由 Python 事件循环在主线程之外执行的。
这意味着我们的老忠实用户cProfile可能不会接受这种本质上异步的服务器,如果我们想真正了解请求期间花费的时间,我们需要一个具有内置异步支持的更现代的分析器。
输入pyinstrument!
pyinstrument是一个统计分析器,与它相反cProfile,它是确定性的。
确定性分析旨在反映以下事实:所有函数调用、函数返回和异常事件都受到监视,并对这些事件之间的间隔(用户代码执行期间)进行精确计时。相比之下,统计分析 [...] 随机采样有效指令指针,并推断时间花在哪里。后一种技术传统上涉及较少的开销(因为不需要对代码进行检测),但仅提供时间花费在何处的相对指示。
其次,它宣传对分析异步 python 代码的本机支持:
pyinstrument`async可以分析使用和的异步程序await。这种异步支持通过跟踪内置[contextvars`](https://docs.python.org/3/library/contextvars.html)模块提供的执行上下文来工作。
Profiler当您以启用或严格(未禁用)的方式启动 a 时async_mode,它Profiler会附加到当前的异步上下文。进行分析时,
pyinstrument请留意上下文。当执行退出上下文时,它捕获导致上下文退出的等待堆栈。在上下文之外花费的任何时间都归因于等待执行的停止。
这应该使我们能够明智地了解 FastAPI 请求的生命周期中时间花费在哪里,同时还跳过速度太快而无法分析的时间段。
将 pyinstrument 与 FastAPI 集成
我们依靠FastAPI.middleware装饰器来注册一个分析中间件(仅在设置为PROFILING_ENABLED时才启用True),负责在profile=true客户端传递查询参数时对请求进行分析。
默认情况下,该中间件将生成与Speedscope (在线交互式火焰图可视化工具)兼容的 JSON 报告。但是,如果profile_format=html传递了查询参数,则简单的 HTML 报告将转储到磁盘。
from fastapi import Request from pyinstrument import Profiler from pyinstrument.renderers.html import HTMLRenderer from pyinstrument.renderers.speedscope import SpeedscopeRenderer def register_middlewares(app: FastAPI): ... if app.settings.PROFILING_ENABLED is True: @app.middleware("http") async def profile_request(request: Request, call_next: Callable): """Profile the current request Taken from https://pyinstrument.readthedocs.io/en/latest/guide.html#profile-a-web-request-in-fastapi with small improvements. """ # we map a profile type to a file extension, as well as a pyinstrument profile renderer profile_type_to_ext = {"html": "html", "speedscope": "speedscope.json"} profile_type_to_renderer = { "html": HTMLRenderer, "speedscope": SpeedscopeRenderer, } # if the `profile=true` HTTP query argument is passed, we profile the request if request.query_params.get("profile", False): # The default profile format is speedscope profile_type = request.query_params.get("profile_format", "speedscope") # we profile the request along with all additional middlewares, by interrupting # the program every 1ms1 and records the entire stack at that point with Profiler(interval=0.001, async_mode="enabled") as profiler: await call_next(request) # we dump the profiling into a file extension = profile_type_to_ext[profile_type] renderer = profile_type_to_renderer[profile_type]() with open(f"profile.{extension}", "w") as out: out.write(profiler.output(renderer=renderer)) # Proceed without profiling return await call_next(request)
您可以浏览项目代码以查看中间件如何连接到应用程序本身
让我们看看结果
HTML 配置文件 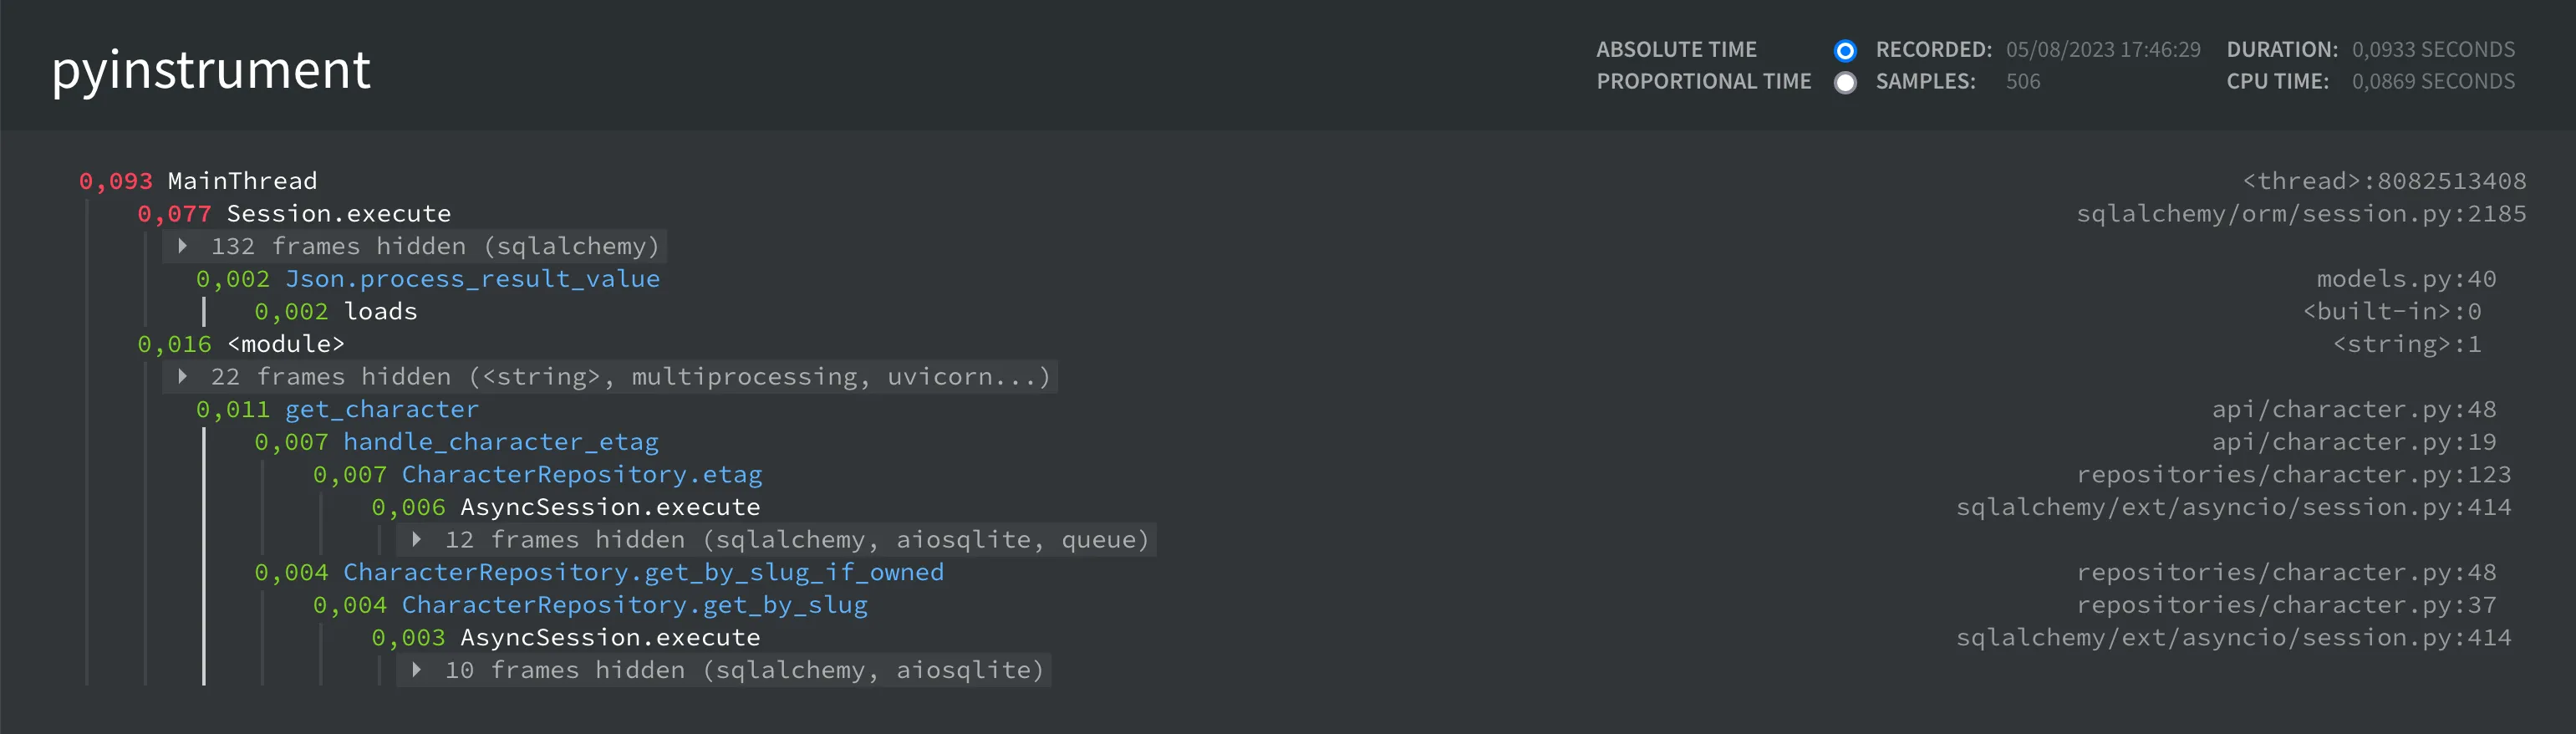
测速仪简介 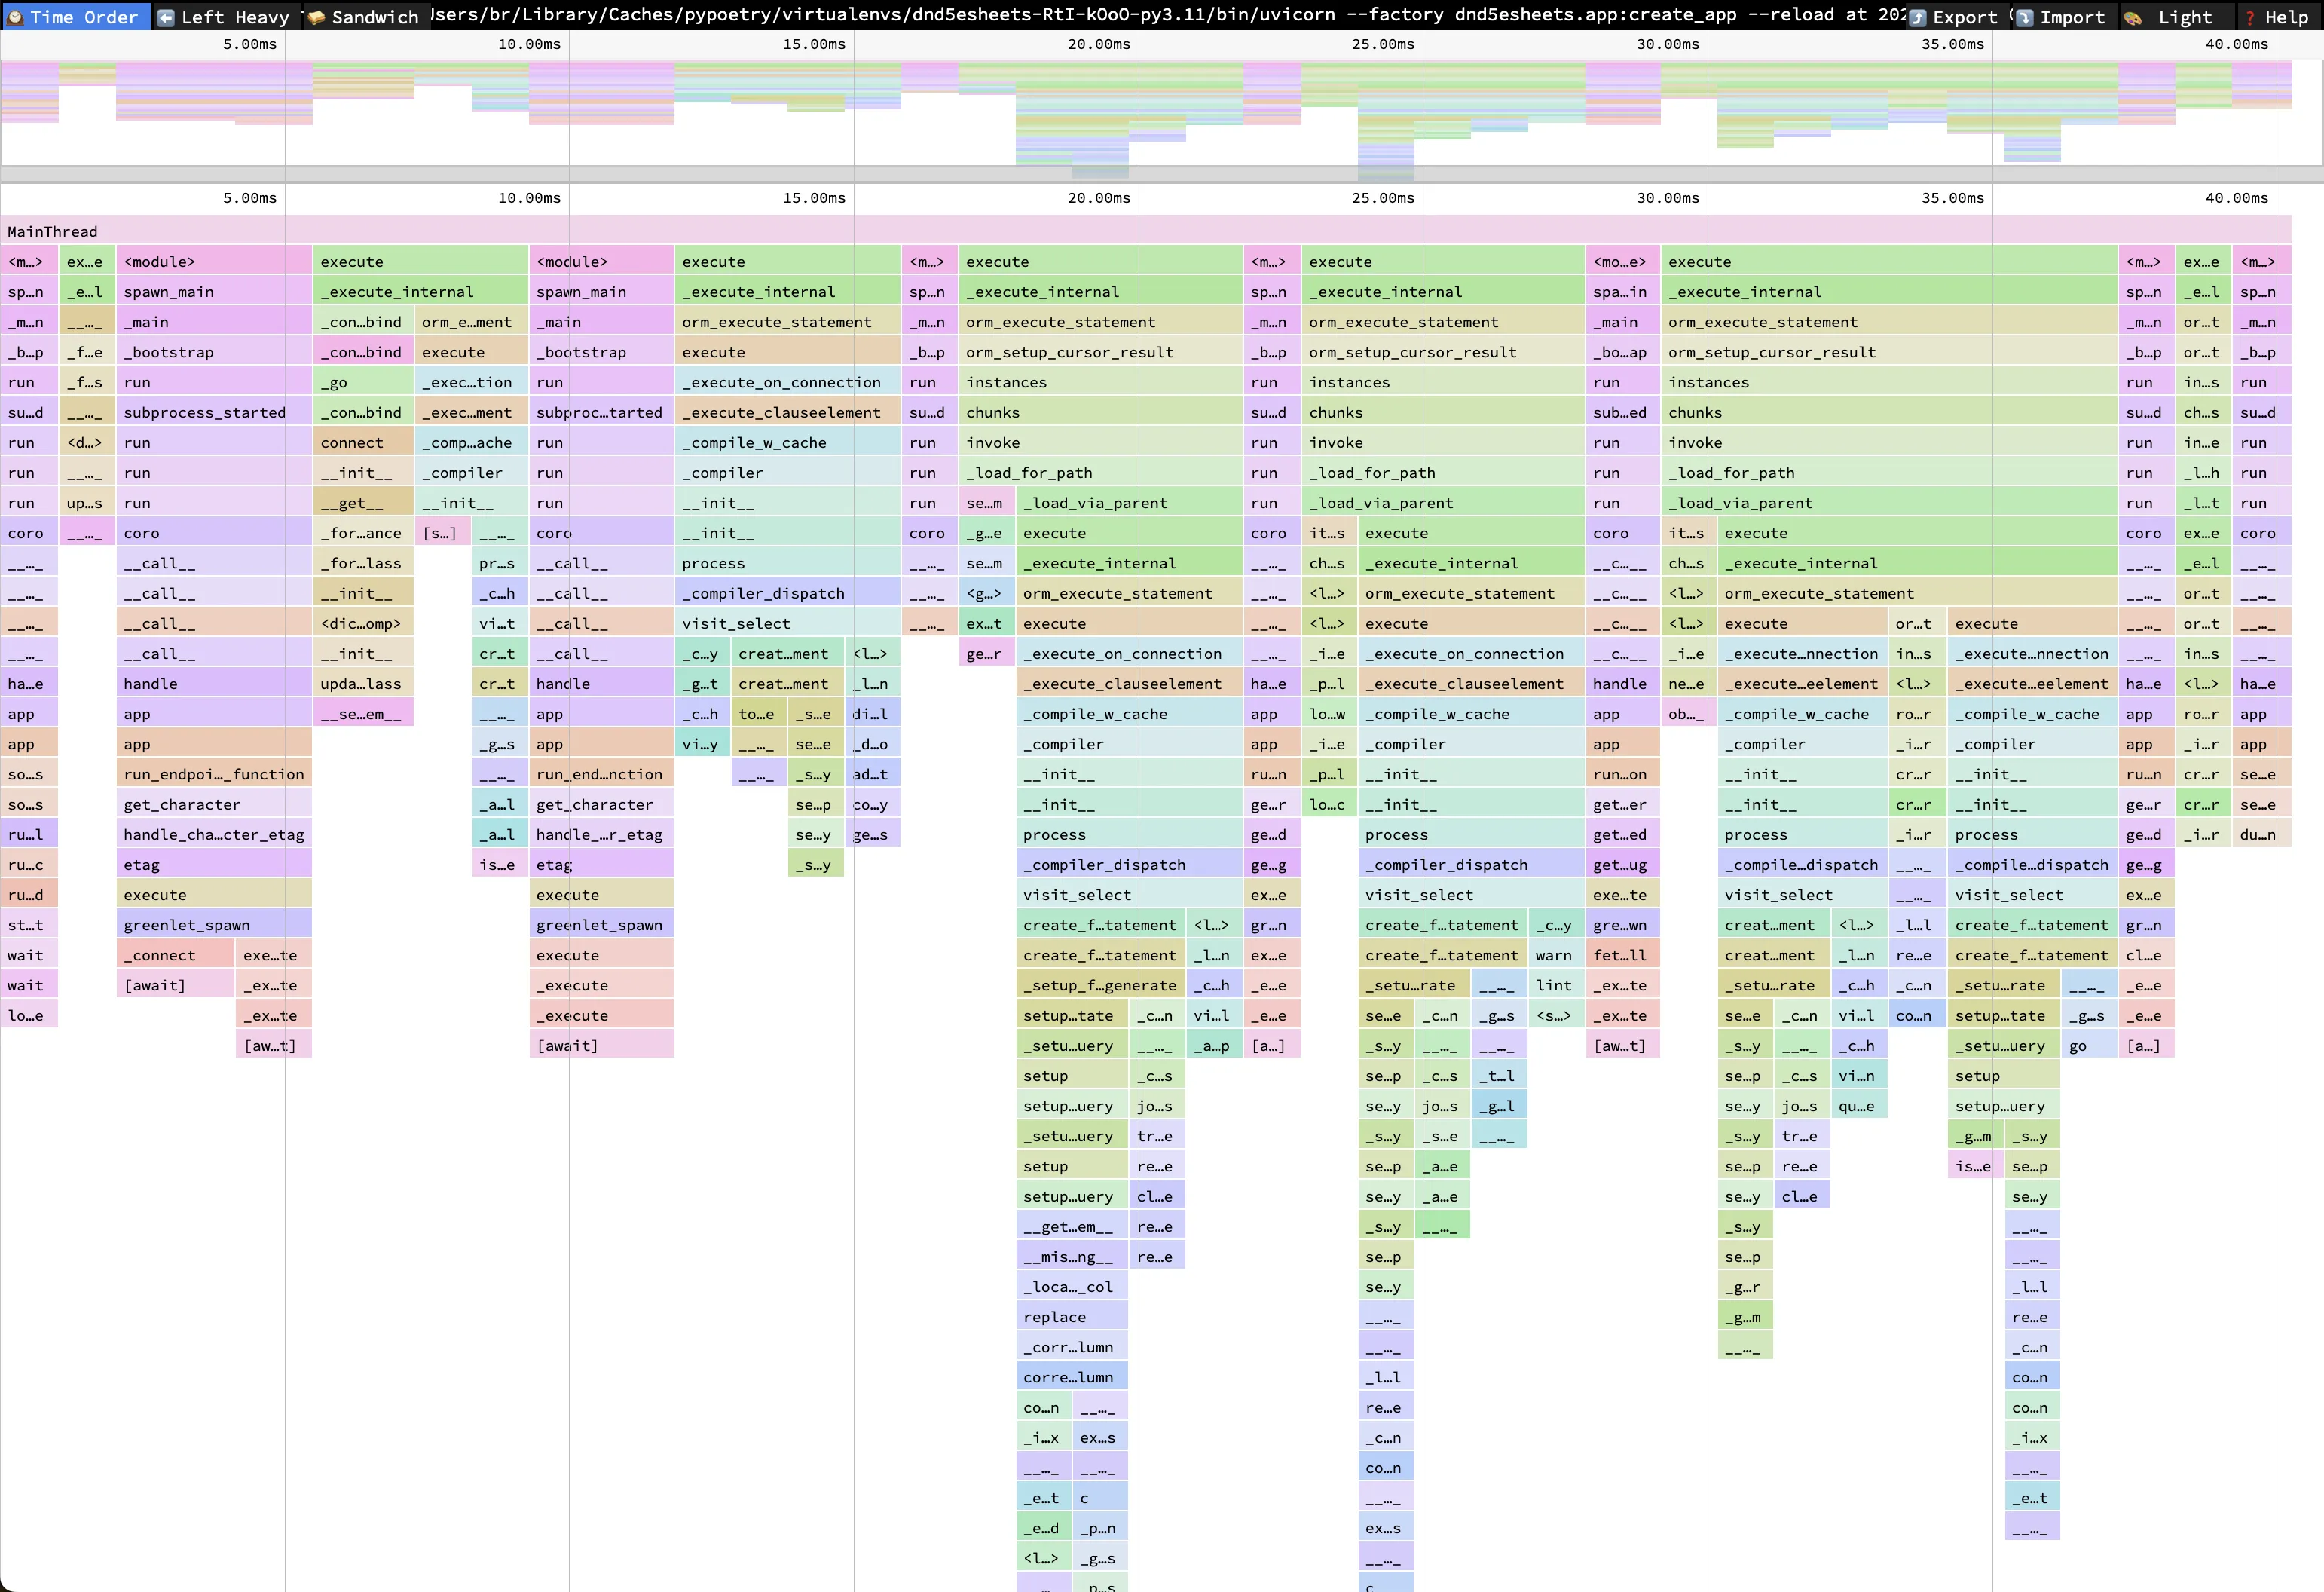
我们非常清楚地看到正在执行的不同 SQL 请求(跨度)、代码中的execute不同子句导致事件循环暂停执行,并且大部分请求时间都花在 SQL 请求上。await
最后,使用此设置,我能够观察从数据库反序列化 JSON 数据时替换stdlib 库的效果,并非常轻松地将该端点加速几个百分点。jsonorjson
评论已关闭