现在您已经熟悉了编码环境,接下来学习如何制作自己的图表!
在本教程中,您将学习怎样用Python来创建专业的线形图。在接下来的练习中,您将使用您的新技能来处理真实世界的数据集。
准备好笔记本
我们首先设置编码环境。
import pandas as pd
import matplotlib.pyplot as plt
%matplotlib inline
import seaborn as sns
print("Setup Complete")
选择一个数据集
本教程的数据集是采用音乐流服务Spotify上的全球每日流行歌曲。 我们专注于2017年和2018年的五首流行歌曲:
- “Shape of You”, by Ed Sheeran
- “Despacito”, by Luis Fonzi
- “Something Just Like This”, by The Chainsmokers and Coldplay
4.”HUMBLE.”, by Kendrick Lamar
- “Unforgettable”, by French Montana
请注意,第一个出现的日期是2017年1月6日,与Ed Sheeran的《Shape of You》的发行日期相对应。而且,通过这个表格,你可以看到《Shape of You》在发行当天在全球被播放了12,287,078次。请注意,其他歌曲在第一行中缺少值,因为它们发布比较晚!
加载数据
正如您在上一篇教程中了解到的,我们使用pd.read_csv命令加载数据集。
# Path of the file to read
spotify_filepath = "../input/spotify.csv"

# Read the file into a variable spotify_data
spotify_data = pd.read_csv(spotify_filepath, index_col="Date", parse_dates=True)
运行上述两行代码的最终结果是,我们现在可以通过使用spotify_data访问数据集。
检查数据
我们可以使用您在上一个教程中学习的head命令打印数据集的前五行。
# Print the first 5 rows of the data
spotify_data.head()
输出: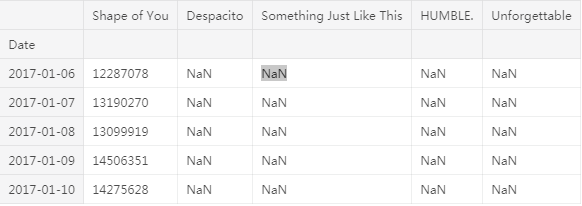
现在检查前五行是否与上面数据集的图像一致(从我们看到它在Excel中的样子时开始)。
空条目将显示为NaN,这是“Not a Number”的缩写。
我们还可以通过做一个小的修改(其中.head()变成.tail())来查看数据的最后五行:
# Print the last five rows of the data
spotify_data.tail()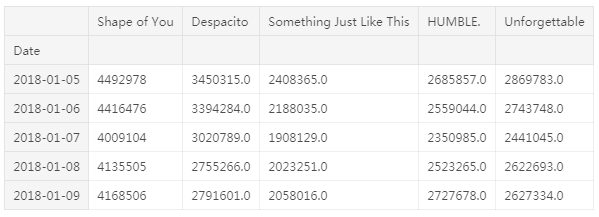
谢天谢地,一切看起来都很正常,每首歌每天都有数百万的全球流量,我们可以继续绘制数据了!
图表数据
现在数据集已经加载到笔记本中,我们只需要一行代码就可以制作一个折线图!
# Line chart showing daily global streams of each song
sns.lineplot(data=spotify_data)
输出:
<matplotlib.axes._subplots.AxesSubplot at 0x7ff650e128d0>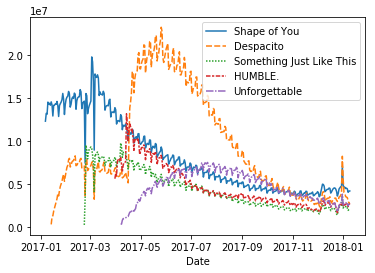
如您所见,代码行相对较短,有两个主要组件:
-
sns.lineplot告诉笔记本我们要创建一个折线图。- 您在本课程中学习的每个命令都将以sns开头,这表示该命令来自seaborn包。 例如,我们使用sns.lineplot来制作折线图。 很快,您将了解到我们分别使用
sns.barplot和sns.heatmap来制作条形图和热图。
- 您在本课程中学习的每个命令都将以sns开头,这表示该命令来自seaborn包。 例如,我们使用sns.lineplot来制作折线图。 很快,您将了解到我们分别使用
data = spotify_data选择将用于创建图表的数据。
请注意,在创建折线图时,您将始终使用相同的格式,并且使用新数据集更改的唯一内容是数据集的名称。 因此,如果您正在使用名为financial_data的其他数据集,则代码行将如下所示:
sns.lineplot(data=financial_data)有时我们还需要修改一些额外的细节,比如图的大小和图表的标题。这些选项都可以用一行代码轻松设置。
# Set the width and height of the figure
plt.figure(figsize=(14,6))

# Add title
plt.title("Daily Global Streams of Popular Songs in 2017-2018")

# Line chart showing daily global streams of each song
sns.lineplot(data=spotify_data)
输出:
<matplotlib.axes._subplots.AxesSubplot at 0x7ff64d53f240>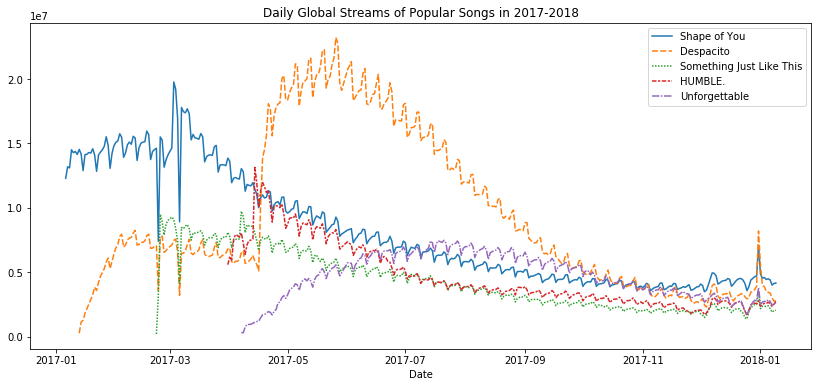
第一行代码将图形的大小设置为14英寸(宽)乘6英寸(高)。要设置任何图形的大小,只需要复制它显示的代码行。然后,如果希望使用自定义大小,请将提供的值14和6更改为所需的宽度和高度。
第二行代码设置图的标题。注意标题必须总是用引号括起来(“…”)!
绘制数据的子集
到目前为止,您已经了解了如何为数据集中的每一列绘制直线。在本节中,您将了解如何绘制列的子集。
我们将从打印所有列的名称开始。这是通过一行代码完成的,可以通过交换数据集的名称(在本例中是spotify_data)来适应任何数据集。
list(spotify_data.columns)输出:
['Shape of You',
 'Despacito',
 'Something Just Like This',
 'HUMBLE.',
 'Unforgettable']
在下一个代码单元格中,我们绘制对应于数据集中前两列的线条。
# Set the width and height of the figure
plt.figure(figsize=(14,6))

# Add title
plt.title("Daily Global Streams of Popular Songs in 2017-2018")

# Line chart showing daily global streams of 'Shape of You'
sns.lineplot(data=spotify_data['Shape of You'], label="Shape of You")

# Line chart showing daily global streams of 'Despacito'
sns.lineplot(data=spotify_data['Despacito'], label="Despacito")

# Add label for horizontal axis
plt.xlabel("Date")
输出:
Text(0.5, 0, 'Date')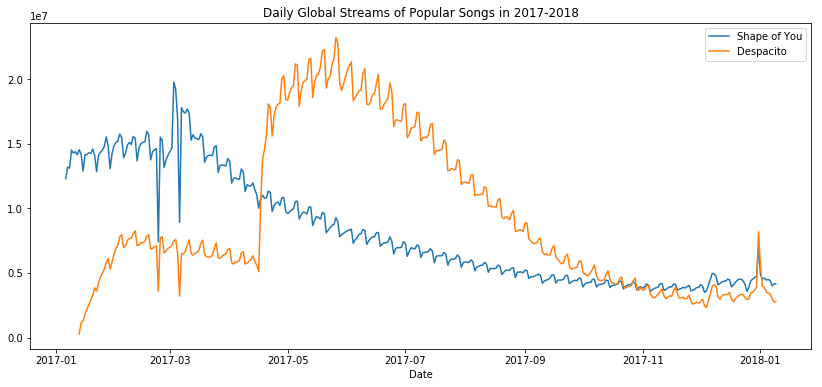
前两行代码设置了图形的标题和大小.
接下来的两行分别向折线图中添加一行。例如,考虑第一个,它为“Shape of You”添加了一行:
# Line chart showing daily global streams of 'Shape of You'
sns.lineplot(data=spotify_data['Shape of You'], label="Shape of You")
此行看起来与我们在数据集中绘制每一行时使用的代码非常相似,但它有一些关键差异:
- 我们设置data = spotify_data [‘Shape of You’]而不是设置data = spotify_data。 通常,为了仅绘制单个列,我们使用此格式,将列的名称放在单引号中并将其括在方括号中。 (要确保正确指定列的名称,可以使用上面学习的命令打印所有列名称的列表。)
- 我们还添加label =“Shape of You”以使该行出现在图例中并设置其对应的标签。
最后一行代码修改水平轴(或x轴)的标签,其中所需标签放在引号(“…”)中。
本地运行代码汇总:
import pandas as pd
import matplotlib.pyplot as plt
import seaborn as sns
from pandas.plotting import register_matplotlib_converters


# Path of the file to read
spotify_filepath = "data-for-datavis/spotify.csv"

# Read the file into a variable spotify_data
spotify_data = pd.read_csv(spotify_filepath, index_col="Date", parse_dates=True)
# Print the first 5 rows of the data
print(spotify_data.head())

# Print the last five rows of the data
print(spotify_data.tail())


register_matplotlib_converters()
# Line chart showing daily global streams of each song
sns.lineplot(data=spotify_data)

# Set the width and height of the figure
plt.figure(figsize=(14,6))

# Add title
plt.title("Daily Global Streams of Popular Songs in 2017-2018")

# Line chart showing daily global streams of each song
sns.lineplot(data=spotify_data)


print(list(spotify_data.columns))

# Set the width and height of the figure
plt.figure(figsize=(14,6))

# Add title
plt.title("Daily Global Streams of Popular Songs in 2017-2018")

# Line chart showing daily global streams of 'Shape of You'
sns.lineplot(data=spotify_data['Shape of You'], label="Shape of You")

# Line chart showing daily global streams of 'Despacito'
sns.lineplot(data=spotify_data['Despacito'], label="Despacito")

# Add label for horizontal axis
plt.xlabel("Date")


plt.show()练习地址:https://www.kaggle.com/scratchpad/kernel92c685be5b/edit
