在本教程中,您将学习如何创建高级散点图。
准备好笔记本
和往常一样,我们从设置编码环境开始。
import pandas as pd
import matplotlib.pyplot as plt
%matplotlib inline
import seaborn as sns
print("Setup Complete")
加载并检查数据
我们将使用一个(合成的)保险费用数据集,看看我们是否能理解为什么有些客户比其他人支付更多。

如果您愿意,您可以在这里阅读关于数据集的更多信息。
# Path of the file to read
insurance_filepath = "../input/insurance.csv"

# Read the file into a variable insurance_data
insurance_data = pd.read_csv(insurance_filepath)
与往常一样,我们通过打印前五行来检查数据集是否正确加载。
insurance_data.head()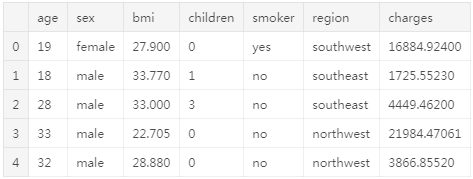
散点图
要创建简单的散点图,我们使用sns.scatterplot命令并指定以下值:
- 水平x轴(
x = insurance_data ['bmi']),和 - 垂直y轴(
y = insurance_data ['charge'])。
sns.scatterplot(x=insurance_data['bmi'], y=insurance_data['charges'])输出:
<matplotlib.axes._subplots.AxesSubplot at 0x7f19008afd68>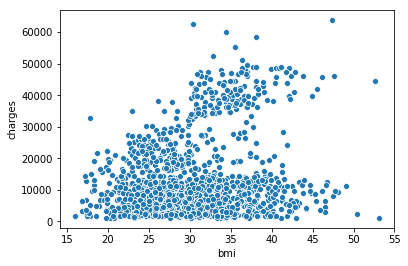
上面的散点图表明,体重指数(BMI)和保险费用正相关,而BMI较高的客户通常也倾向于支付更高的保险费用。 (这种模式是有道理的,因为高BMI通常与慢性疾病的高风险相关。)
要仔细检查此关系的强度,您可能希望添加回归线或最适合数据的线。 我们通过将命令更改为sns.regplot来完成此操作。
sns.regplot(x=insurance_data['bmi'], y=insurance_data['charges'])输出:
/opt/conda/lib/python3.6/site-packages/scipy/stats/stats.py:1713: FutureWarning: Using a non-tuple sequence for multidimensional indexing is deprecated; use `arr[tuple(seq)]` instead of `arr[seq]`. In the future this will be interpreted as an array index, `arr[np.array(seq)]`, which will result either in an error or a different result.
  return np.add.reduce(sorted[indexer] * weights, axis=axis) / sumval
<matplotlib.axes._subplots.AxesSubplot at 0x7f18fcf85e80>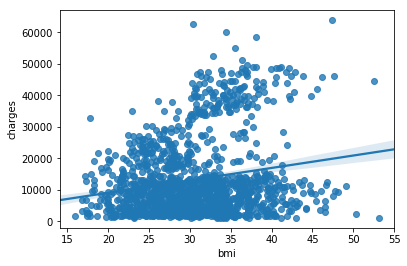
颜色编码的散点图
我们可以使用散点图来显示三个变量之间的关系!一种方法是用颜色编码这些点。
例如,为了了解吸烟是如何影响BMI和保险成本之间的关系,我们可以用“吸烟者”来对这些点进行颜色编码,并在坐标轴上标出另外两列(BMI, charge)。
sns.scatterplot(x=insurance_data['bmi'], y=insurance_data['charges'], hue=insurance_data['smoker'])输出:
<matplotlib.axes._subplots.AxesSubplot at 0x7f18fce7c710>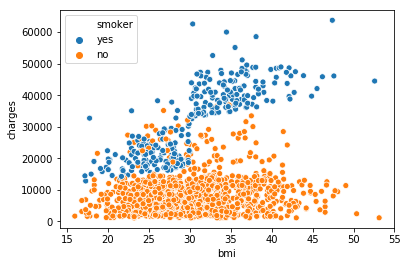
这个散点图显示,随着体重指数的增加,不吸烟的人愿意支付更多的钱,而吸烟的人支付更多。
为了进一步强调这一事实,我们可以使用sns.lmplot命令添加两个回归线,分别对应于吸烟者和非吸烟者。(您会注意到,相对于非吸烟者,吸烟者的回归曲线斜率要大得多!)
sns.lmplot(x="bmi", y="charges", hue="smoker", data=insurance_data)输出:
/opt/conda/lib/python3.6/site-packages/scipy/stats/stats.py:1713: FutureWarning: Using a non-tuple sequence for multidimensional indexing is deprecated; use `arr[tuple(seq)]` instead of `arr[seq]`. In the future this will be interpreted as an array index, `arr[np.array(seq)]`, which will result either in an error or a different result.
  return np.add.reduce(sorted[indexer] * weights, axis=axis) / sumval
<seaborn.axisgrid.FacetGrid at 0x7f18fce61160>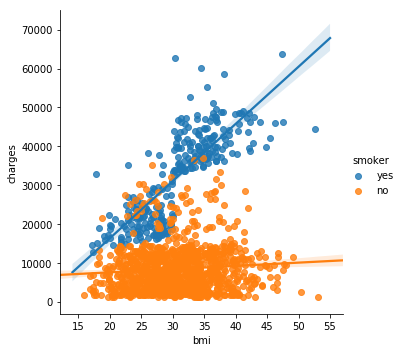
sns.lmplot命令的工作原理与您目前学到的命令略有不同:
- 我们没有设置x=insurance_data[‘bmi’]来选择insurance_data中的’bmi’列,而是设置x=”bmi”来指定列的名称。
- 同样,y=”charge “和hue=” smoking “也包含列的名称
- 我们使用data=insurance_data指定数据集。
最后,还有一个你会学到的图,它可能看起来和你习惯看到的散点图有点不同。通常,我们使用散点图来突出两个连续变量(如“bmi”和“charge”)之间的关系。但是,我们可以调整散点图的设计,使其在一个主轴上显示一个分类变量(如“smoking”)。我们将此图类型称为分类散点图,并使用sns.swarmplot命令构建它。
sns.swarmplot(x=insurance_data['smoker'],
              y=insurance_data['charges'])
输出:
<matplotlib.axes._subplots.AxesSubplot at 0x7f18fc5c06d8>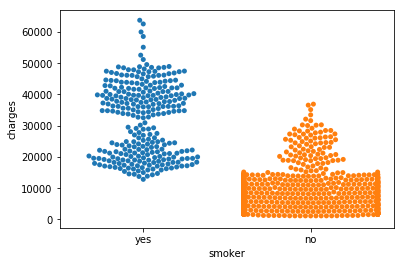
除此之外,这幅图还告诉我们:
- 平均而言,非吸烟者的收费比吸烟者低,而且支付最多的顾客是吸烟者;而花费最少的顾客是非吸烟者。
本地可运行代码:
import pandas as pd
import matplotlib.pyplot as plt
import seaborn as sns

# Path of the file to read
insurance_filepath = "data-for-datavis/insurance.csv"

# Read the file into a variable insurance_data
insurance_data = pd.read_csv(insurance_filepath)

print(insurance_data.head())

sns.scatterplot(x=insurance_data['bmi'], y=insurance_data['charges'])

# 添加回归线
sns.regplot(x=insurance_data['bmi'], y=insurance_data['charges'])

# 颜色区分
sns.scatterplot(x=insurance_data['bmi'], y=insurance_data['charges'], hue=insurance_data['smoker'])

# 2条回归线
sns.lmplot(x="bmi", y="charges", hue="smoker", data=insurance_data)

# 分类散点图
sns.swarmplot(x=insurance_data['smoker'],
              y=insurance_data['charges'])

plt.show()在线联系地址:https://www.kaggle.com/xugj520/exercise-scatter-plots/edit
